-

Join your peers at SSTI's 2024 Annual Conference!
Join us December 10-12 in Arizona to connect with and learn from your peers working around the country to strengthen their regional innovation economies. Visit ssticonference.org for more information and to register today.
-

As the most comprehensive resource available for those involved in technology-based economic development, SSTI offers the services that are needed to help build tech-based economies. Learn more about membership...
-

Subscribe to the SSTI Weekly Digest
Each week, the SSTI Weekly Digest delivers the latest breaking news and expert analysis of critical issues affecting the tech-based economic development community. Subscribe today!
Useful Stats: Establishment births and deaths and employment growth and loss, 2000-2018


This edition of Useful Stats examines — by state and over the period from 2000 to 2018 — how many new establishments were founded, how many jobs these new establishments created, how many establishments closed, and how many jobs were lost from those closing establishments. In only one year, the last year of the period, 2018, all states experienced positive net gains in employment and establishments, based on data from the Bureau of Labor Statistics. As shown in the interactive map below, the states that had the greatest number of new establishments in 2018 were California (63,073), Florida (31,063), Texas (28,079), Washington (20,525), and New York (13,967). The states that experienced the greatest net employment numbers in 2018 were California (177,061), Florida (117,746), Texas (115,624), Washington (45,394), and New York (44,045).
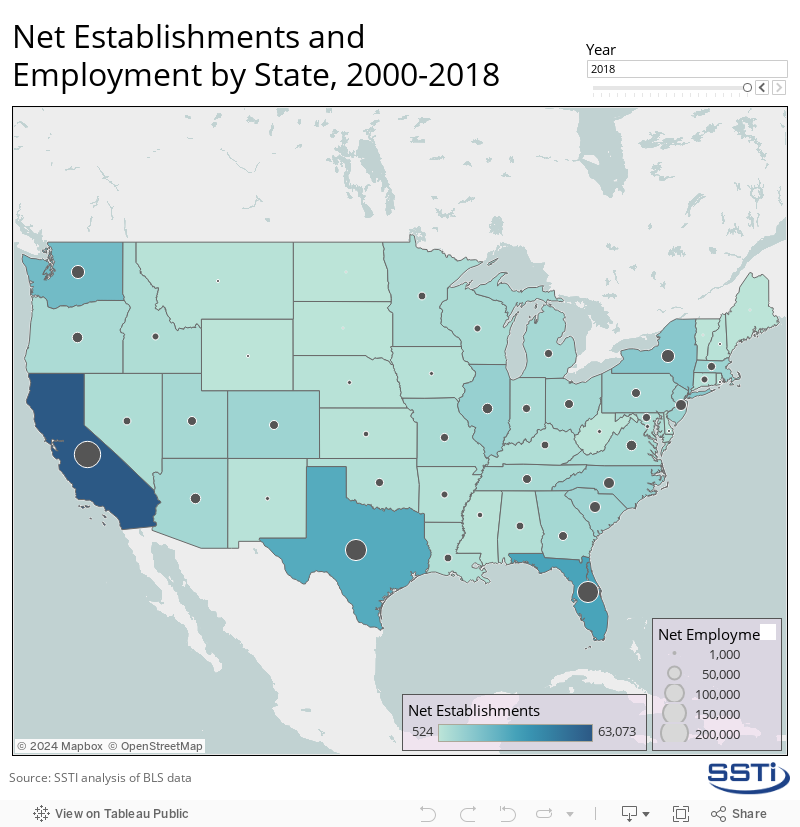
By selecting “All” in the year slider on the map above, we can see that the states which experienced the greatest net change in establishments over the entire period were California (473,902), Florida (151,824), Texas (141,467), New York (57,381), and Massachusetts (54,513). The states that experienced the greatest increase in employment over the period were Texas (896,087 jobs), California (629,070 jobs), Florida (487,662 jobs), North Carolina (289,585 jobs), and Virginia (246,075 jobs). Only a few states experienced net negative change in new establishments over the period. These states were Ohio (-12,590), Michigan (-4,293), West Virginia (-3,530), and Mississippi (-246).
The ratio of jobs gained per each new establishment and the ratio of jobs lost per each closed establishment for the years 2000 to 2018 is shown in the following image. The maps are shaded darker to show higher ratios while the bubbles sized per number of establishments are included for context.
Viewing the data in this way, the top map shows that the states where the greatest number of jobs were created for each establishment opened in 2018 were Oklahoma (4.7), Alabama (4.5), West Virginia (4.5), Mississippi (4.4), and Louisiana (4.3). The states where the fewest number of jobs were created for each opening establishment were Montana (2.5), Washington (2.5), Vermont (2.5), California (2.7), Idaho (2.7), New Hampshire (2.7), and South Dakota (2.7).
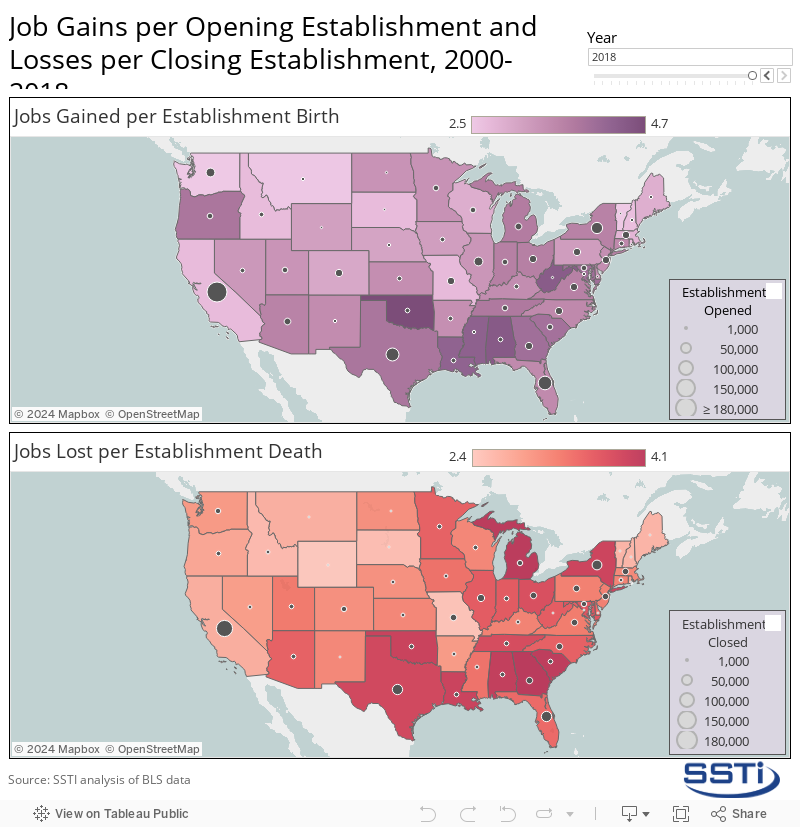
The second map above shows that the states where the greatest numbers of jobs were lost for every closing establishment in 2018 were Georgia (4.1), Michigan (4.1), Alabama (4.0), South Carolina (4.0), Louisiana (3.9), Oklahoma (3.9), and New York (3.9). The states where the number of lost jobs for each closing establishment was the lowest in 2018 were Missouri (2.4), Wyoming (2.4), Idaho (2.5), and South Dakota (2.5).
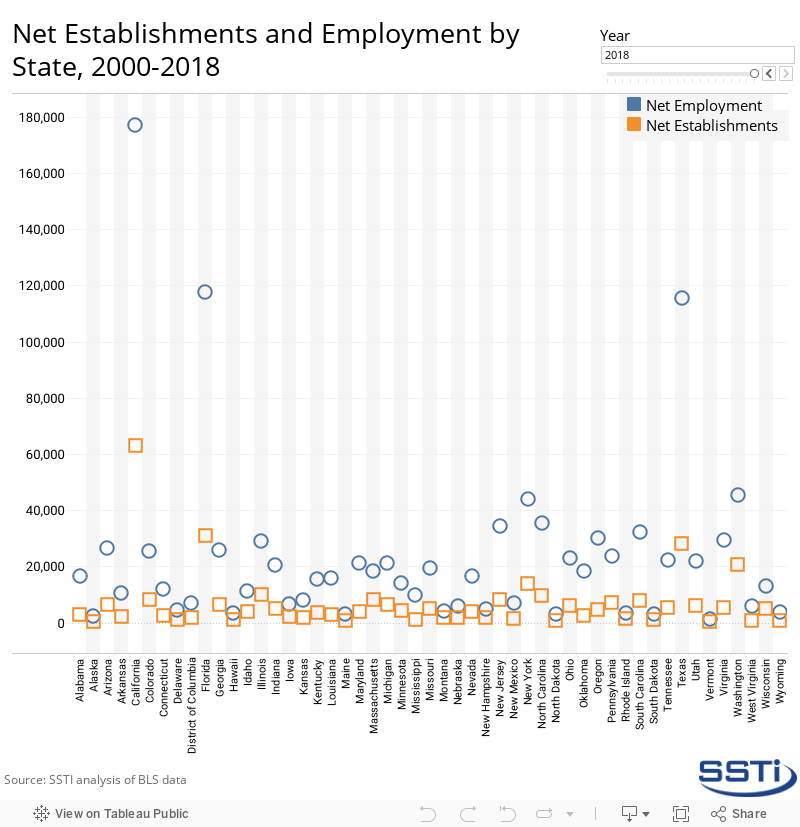
The following chart provides another visualization for net employment and establishment changes over the period.
A spreadsheet of the data can be accessed here.