

-

Join your peers at SSTI's 2024 Annual Conference!
Join us December 10-12 in Arizona to connect with and learn from your peers working around the country to strengthen their regional innovation economies. Visit ssticonference.org for more information and to register today.
-

As the most comprehensive resource available for those involved in technology-based economic development, SSTI offers the services that are needed to help build tech-based economies. Learn more about membership...
-

Subscribe to the SSTI Weekly Digest
Each week, the SSTI Weekly Digest delivers the latest breaking news and expert analysis of critical issues affecting the tech-based economic development community. Subscribe today!
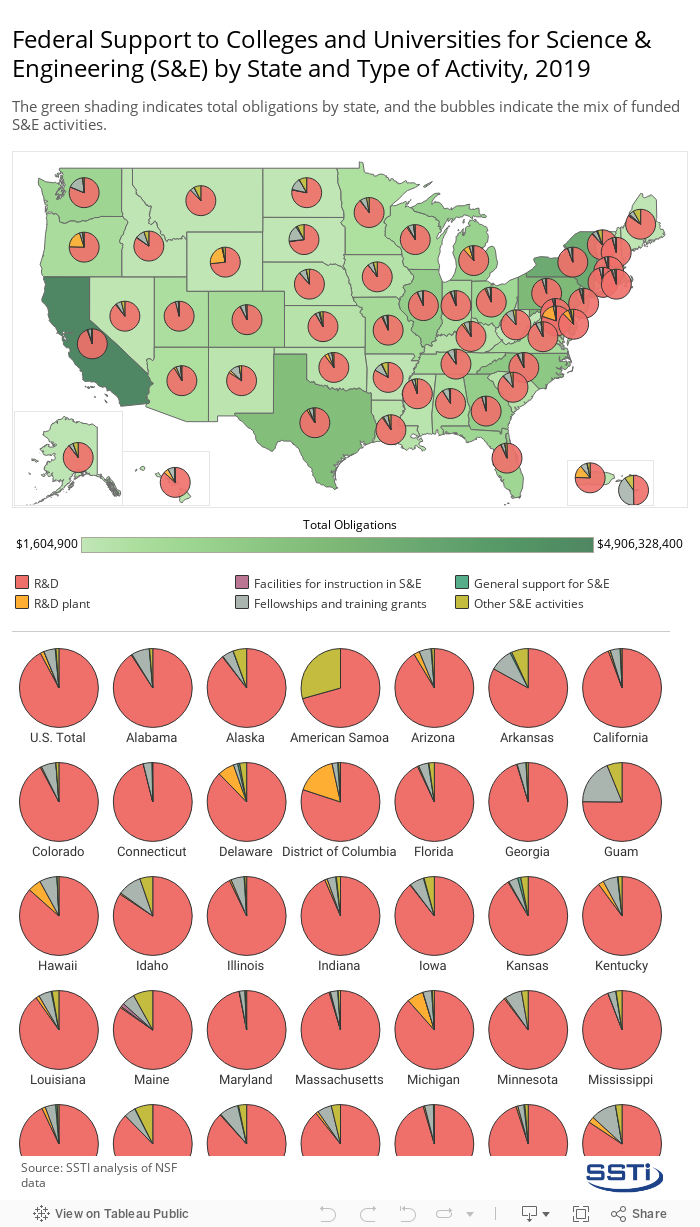
Useful Stats: Federal support to colleges and universities for science & engineering by state and type of activity, 2019


Developing local assets and nurturing local talent in science and engineering (S&E) is paramount to productive innovation economies. Institutions of higher education (IHEs) are arguably the most important elements of these local knowledge-capital assets — housing physical R&D infrastructure, training new scientists and engineers, and creating and disseminating new knowledge across the academic, public, and private sectors. As such, understanding how federal funding to support S&E at IHEs is dispersed across states can help local innovation leaders develop programs and policies to continue growing their local innovation economies.
To assist in this goal, this edition of Useful Stats explores data from the National Science Foundation’s Survey of Federal Science and Engineering Support to Universities, Colleges, and Nonprofit Institutions. Specifically, this analysis examines state-level data for total S&E obligations to IHEs and the shares of total S&E funding by type of activity in 2019.
Nationally in 2019, the federal government obligated $38.08 billion in science and engineering (S&E) support to 1,034 U.S. colleges and universities. As shown by the green shading in the interactive map below, the states that received the greatest total amount of federal S&E funding in 2019 were California ($4.91 billion); New York ($3.16 billion); Maryland ($2.42 billion); Pennsylvania ($2.40 billion); and Texas ($2.15 billion).
Digging deeper into these figures, and evaluating how these federal funds are divided among various S&E activities across states gives insight into the types of knowledge assets being developed in an area. Depending on unique local circumstances, some innovation economies could benefit from greater federal investment in research facilities, while others might benefit from greater investment in fellowships and other training activities, while other areas may be more suited to maximize investment in R&D.
As seen in the interactive pie charts above, R&D was the major activity driving federal funding in S&E at U.S. colleges and universities in 2019 — accounting for 92.2 percent of the total federal S&E support to IHEs in that year. The states with the greatest R&D shares of total federal obligations in 2019 were Maryland (96.9 percent); Connecticut (96.1 percent); Utah (96 percent); New Hampshire (95.4 percent); and Massachusetts ($95.3 percent).
The activity with the next greatest share of total obligations was Fellowships and Training Grants which accounted for 4.7 percent ($1.8 billion) of total federal S&E obligations to the nation’s IHEs in 2019. The states with the greatest shares of federal investment in Fellowships and Training Grants in 2019 were the Virgin Islands (40.3 percent); Guam (18.7 percent); South Dakota (17.8 percent); Washington (17.3 percent); and North Dakota (13.2 percent).
Following R&D and Fellowships and Training Grants, the activities with the next greatest shares of total obligations were R&D Plant (1.6 percent, $593.7 million); Other S&E Activities (1.2 percent, $460.8 million); General Support (0.25 percent, $96.1 million); and, Facilities for Instruction (0.02 percent $6.1 million).
Click here for the SSTI spreadsheet used in this analysis.
useful stats, higher ed, r&d