

-

Join your peers at SSTI's 2024 Annual Conference!
Join us December 10-12 in Arizona to connect with and learn from your peers working around the country to strengthen their regional innovation economies. Visit ssticonference.org for more information and to register today.
-

As the most comprehensive resource available for those involved in technology-based economic development, SSTI offers the services that are needed to help build tech-based economies. Learn more about membership...
-

Subscribe to the SSTI Weekly Digest
Each week, the SSTI Weekly Digest delivers the latest breaking news and expert analysis of critical issues affecting the tech-based economic development community. Subscribe today!
Useful Stats: Higher ed spring term enrollment estimates by state, 2019-2021


Enrollment in the nation’s institutions of higher education is an important indicator of the knowledge capital available to local innovation economies. This edition of Useful Stats explores enrollment data from the recently updated National Student Clearinghouse Research Center (NSCRC) report , Current Term Enrollment Estimates, covering spring term enrollment trends at degree-granting institutions of higher education. Specifically, this analysis examines enrollment per 1,000 residents by state*, the change in total enrollment over prior spring terms, as well as enrollment by type of institution by state from spring term 2019 to spring term 2021.
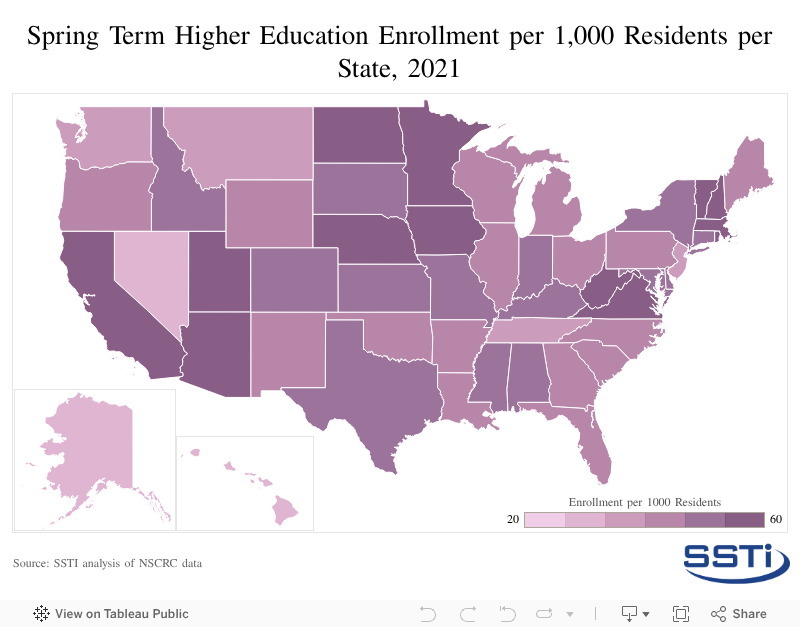
Enrollment per 1,000 residents
While total enrollment trends by state follow state population trends, the number of enrolled students per 1,000 state residents gives a more standardized view of state enrollment. As seen in the map below, the states with the greatest number of students enrolled per 1,000 residents in spring term 2021 were New Hampshire (136); Utah (112): West Virginia (75); Nebraska (64); and Minnesota (61). The states with the fewest number of enrolled students per 1,000 residents in spring term of 2021 were New Jersey (38); Montana (37); Hawaii (33); Nevada (32); and Alaska (28).
Percent change in enrollment over the previous spring term
The report also provides data on the percent change in total enrollment over the previous two spring terms (2019 and 2020) by state. Nationally, enrollment dropped by 3.5 percent in spring term of 2021 from spring term of 2020 likely as a result of the pandemic. As seen in the interactive map below, the rate of annual change varied widely among states. Seven states reported growth in enrollment over the last year, with New Hampshire (10.8 percent) showing the greatest growth, followed by Utah (4.7 percent); West Virginia (2.8 percent); Nebraska (2.4 percent); Virginia (1.3 percent); Maryland (0.7 percent); and Idaho (0.4 percent). However, most states** saw declines in spring term enrollment, with the greatest decreases reported in Wyoming (-6.2 percent); Kansas (-6.3 percent); Michigan (-6.4 percent); Delaware (-7.7 percent); and New Mexico (-11.4 percent). The charts below the map show the three-year enrollment trends.

Enrollment by type of institution
While enrollment dropped across public four-year, public two-year, and private nonprofit four-year institutions, the largest drops in enrollment came from public two-year institutions nationally and in most states, similar to what we have reported previously. In total, the average decrease in spring term enrollment was -3 percent at public four-year institutions, -4.7 percent at private nonprofit four-year institutions, and -9.7 percent at public two-year institutions.
The states with the greatest decreases in enrollment at public two-year colleges from spring term 2020 to spring term 2021 were Massachusetts (-14.8 percent); Louisiana (-16.6 percent); Pennsylvania (-16.7 percent); New Mexico (-16.9 percent); and Connecticut (-17.4 percent). The charts in the image above show the shares of enrollment by type of institution in states***.
Click here for the data used in this analysis.
*2020 state population figures were used for 2021 enrollment per 1,000 resident calculations since 2021 state population estimates are not available as of publication time.
**The report also identifies “Multi-state institutions” which are not included in the state figures, but represented more than 600,000 students in spring term of 2021. These institutions operate in multiple states and are typically large, private for-profit institutions. Enrollment at these institutions declined by 0.5 percent from spring term 2020 to spring term 2021.
***Data at the type of institution level are not available for the following seven states: Alaska; Delaware; Nevada; Wyoming; Rhode Island; Indiana; and Vermont.
useful stats, higher ed