

-

Join your peers at SSTI's 2024 Annual Conference!
Join us December 10-12 in Arizona to connect with and learn from your peers working around the country to strengthen their regional innovation economies. Visit ssticonference.org for more information and to register today.
-

As the most comprehensive resource available for those involved in technology-based economic development, SSTI offers the services that are needed to help build tech-based economies. Learn more about membership...
-

Subscribe to the SSTI Weekly Digest
Each week, the SSTI Weekly Digest delivers the latest breaking news and expert analysis of critical issues affecting the tech-based economic development community. Subscribe today!
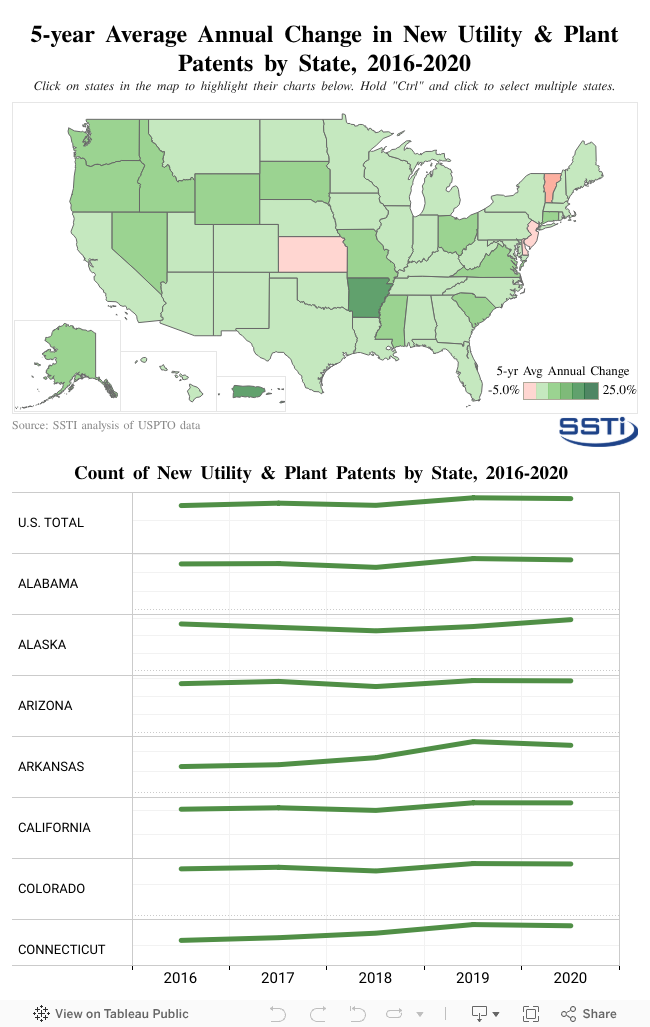
Useful Stats: New utility and plant patents by state, 2016-2020


This edition of Useful Stats explores data from the U.S. Patent and Trade Office (USPTO) on new utility and plant patents granted in the U.S. by state/territory for the five-year period from 2016 to 2020. This analysis includes only utility and plant patents as these types are those associated with the invention of new products and services, and excludes reissued patents and those issued for purely aesthetic designs.
State patent activity is a good indicator of the health of local innovation economies. Patents for innovative products and processes are issued to inventors across academia, industry, and the public sector, and the number of these new patents issued in states over time can provide insights into the strengths of these sectors and how well they are collectively able to bring innovative technologies out of the lab and, potentially, to market. Understanding this patent activity can help program and policy designers in local innovation economies in evaluating, enhancing, and developing their initiatives.
The areas with the greatest total number of patents in 2020 are generally those with greater populations, with California (46,248 patents), Texas (12,224 patents), and New York (9,364 patents) leading the states. In the same year, the states with the least total number of patents were West Virginia (119 patents), Alaska (59 patents), and Puerto Rico (53 patents).
However, evaluating these patent grants over time can provide better context for state and local innovation leaders to assess their innovation economies. The interactive map below shows the five-year average annual growth rate in patent grants by state for the period from 2016 to 2020. The area with the greatest average rate of change over the period was the District of Columbia (19.1 percent), followed by Puerto Rico (15.2 percent), Arkansas (15.2 percent), Alaska (9.2 percent), and Connecticut (8.9 percent). The states with the lowest rates were Minnesota (0.0 percent), New Jersey (-0.2 percent), Delaware (-0.8 percent), Kansas (-2.8 percent), and Vermont (-6.2 percent).
The state charts below the map show the total number of patents awarded by year. Clicking on a state in the interactive map will highlight its chart below. Hold “Ctrl” while clicking on multiple states in the map to select multiple state charts to highlight.
Click here for the data used in this analysis.
useful stats, patents