In FY 2013, the federal government obligated $25.9 billion for science and engineering research and development (S&E R&D) at colleges and universities, a decrease of $1.6 billion from FY 2012 (5.7 percent). Eight states (California, New York, Maryland, Pennsylvania, Massachusetts, Texas, North Carolina, and Illinois) each received more than $1 billion in funding during FY 2013, though each state also experienced a decrease from their FY 2012 total. In total, these eight states received $14.1 billion from the federal government for S&E R&D at their colleges and universities, representing 54 percent of the government’s total. This share has remained relatively constant since 2008.
Just 14 states experienced an increase in federal obligations for S&E R&D at universities and colleges from FY 2012 to FY 2013. Four states experienced increases larger than 10 percent over the course of the year: Vermont (19.7 percent), Alaska (13.9 percent), Maine (13.1 percent) and Nevada (11.59 percent). None of these states had a university or college, however, which was in the top 100 for total obligations.
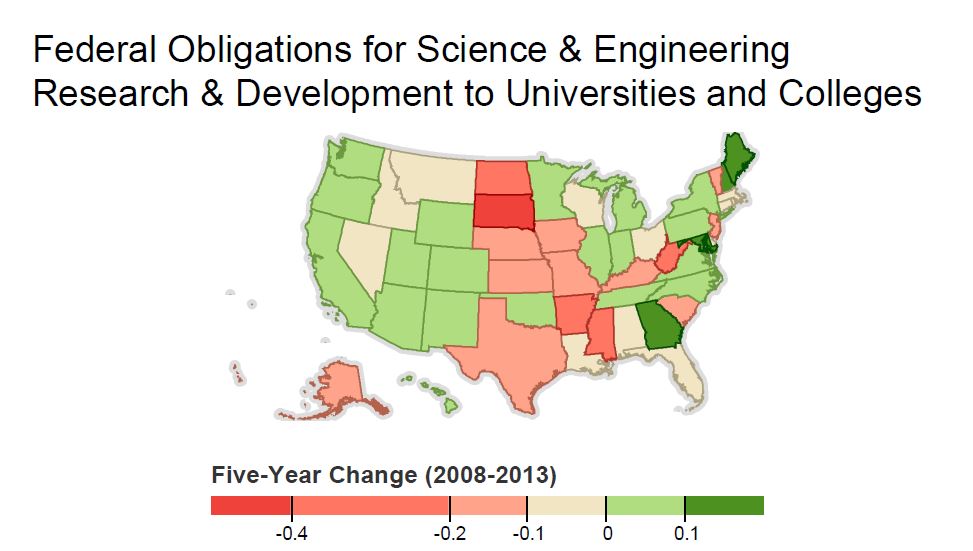
Over the five-year period from FY 2008 through FY 2013, 24 states experienced an increase in federal obligations for S&E R&D at universities and colleges. Georgia (22.6 percent), Maine (21.4 percent), New Hampshire (15.7 percent), Maryland (14.9 percent) and the District of Columbia (12.6 percent) each experienced the largest increase in S&E R&D at universities and colleges. Georgia’s growth is largely a result of increased funding to the Georgia Institute of Technology, whose funding grew from $177.7 million in 2008 to $292 million in 2013 (a 64 percent increase, the highest of any university besides the Consortium for Ocean Leadership). Maine’s impressive growth from FY 2008 to FY 2013 is largely a result of a small denominator: in 2008, Maine was ranked behind every state except for Wyoming with just $31.7 million in federal obligations for S&E R&D at universities. New Hampshire’s growth in S&E R&D funding comes with Dartmouth College, the state’s most research-intensive university, staying relatively stagnant. In FY 2008, Dartmouth received $97.3 million, compared to $101.9 million in FY 2013 – an increase of about 4.7 percent. Given that New Hampshire received $150.2 million in federal obligations for S&E R&D at colleges and universities in FY 2013, considerably more than Dartmouth’s total, it can be surmised that the majority of the state’s growth in obligations occurred at other institutions.
The map below suggests that there are some regional differences in terms of which states received more or less funding for S&E R&D from the federal government between FY 2008 and FY 2013. While states on the Coasts largely received increases in funding over the five-year period, Plains states fared less favorably. South Dakota received 48.7 percent fewer obligations from the federal government between FY 2008 and FY 2013, the most of any state. North Dakota, which had the third highest decrease, received 38 percent fewer in federal obligations for S&E R&D over the five-year span.
Download the table in Excel format at: http://ssti.org/sites/default/files/073015.xlsx
Federal obligations for science and engineering research and development to universities and colleges, by state and outlying area: FY 2005–13
(Dollars, in Thousands)
| State and outlying area | 2008 | 2009 | 2010 | 2011 | 2012 | 2013 |
|---|---|---|---|---|---|---|
| Alabama | 328,405.0 | 395,388.0 | 360,681.7 | 348,349.9 | 347,187.4 | 320,790.1 |
| Alaska | 69,871.0 | 90,298.9 | 72,292.1 | 76,613.2 | 54,729.1 | 62,345.3 |
| Arizona | 337,224.0 | 433,445.6 | 368,507.8 | 386,576.3 | 441,857.9 | 369,922.5 |
| Arkansas | 80,854.0 | 103,093.6 | 108,832.1 | 85,157.3 | 67,191.0 | 60,412.6 |
| California | 3,538,729.0 | 4,244,849.9 | 4,281,199.0 | 3,934,976.4 | 3,934,256.6 | 3,754,785.7 |
| Colorado | 560,946.0 | 689,736.8 | 618,374.2 | 576,207.3 | 556,766.0 | 563,725.4 |
| Connecticut | 503,755.0 | 587,690.4 | 597,309.0 | 538,354.0 | 514,764.4 | 484,829.6 |
| Delaware | 82,694.0 | 112,898.2 | 85,595.0 | 89,496.1 | 76,631.1 | 80,240.5 |
| District of Columbia | 252,978.0 | 329,905.8 | 272,361.1 | 268,323.9 | 311,550.2 | 284,743.6 |
| Florida | 618,996.0 | 780,910.8 | 767,232.4 | 667,985.1 | 653,164.7 | 601,576.6 |
| Georgia | 631,080.0 | 778,307.3 | 768,078.6 | 745,619.5 | 749,875.7 | 773,486.6 |
| Hawaii | 150,210.0 | 185,823.2 | 209,274.0 | 162,958.4 | 169,025.4 | 153,614.6 |
| Idaho | 41,588.0 | 57,812.0 | 47,918.3 | 42,194.9 | 40,273.7 | 39,771.4 |
| Illinois | 1,010,389.0 | 1,231,577.9 | 1,112,340.3 | 1,135,499.3 | 1,054,718.6 | 1,033,467.3 |
| Indiana | 364,647.0 | 532,646.3 | 497,625.0 | 420,151.7 | 396,212.0 | 365,056.9 |
| Iowa | 303,830.0 | 328,188.6 | 318,704.4 | 308,226.8 | 281,146.1 | 264,226.8 |
| Kansas | 156,656.0 | 194,549.4 | 206,673.2 | 172,522.2 | 166,619.1 | 140,099.6 |
| Kentucky | 190,494.0 | 241,488.3 | 208,737.3 | 199,685.2 | 177,427.9 | 167,754.3 |
| Louisiana | 179,285.0 | 226,410.2 | 198,562.3 | 198,736.9 | 167,683.8 | 165,827.4 |
| Maine | 31,687.0 | 52,751.3 | 49,929.6 | 30,071.2 | 34,023.2 | 38,467.4 |
| Maryland | 1,459,843.0 | 1,905,830.3 | 1,972,721.5 | 1,823,177.1 | 1,824,509.2 | 1,677,487.3 |
| Massachusetts | 1,505,846.0 | 1,834,374.5 | 1,736,407.1 | 1,579,725.3 | 1,625,480.8 | 1,472,938.3 |
| Michigan | 787,554.0 | 1,046,947.3 | 996,184.8 | 968,965.3 | 916,303.0 | 857,350.7 |
| Minnesota | 359,245.0 | 467,634.4 | 426,590.3 | 493,289.2 | 394,236.0 | 382,091.6 |
| Mississippi | 156,254.0 | 157,140.4 | 180,457.3 | 116,976.0 | 101,340.3 | 105,162.7 |
| Missouri | 571,215.0 | 663,734.3 | 621,206.8 | 537,910.5 | 525,196.2 | 470,222.6 |
| Montana | 80,894.0 | 109,146.3 | 84,094.3 | 91,587.9 | 67,143.9 | 73,034.1 |
| Nebraska | 128,835.0 | 173,230.3 | 177,399.5 | 122,934.9 | 130,475.4 | 114,391.2 |
| Nevada | 55,189.0 | 85,874.5 | 82,110.9 | 49,796.0 | 48,576.4 | 54,205.0 |
| New Hampshire | 129,860.0 | 158,405.4 | 151,827.6 | 136,437.6 | 146,842.8 | 150,195.4 |
| New Jersey | 408,017.0 | 522,561.5 | 475,221.9 | 443,513.3 | 421,992.2 | 362,796.0 |
| New Mexico | 163,539.0 | 196,551.9 | 180,212.7 | 157,949.4 | 167,146.0 | 174,389.4 |
| New York | 1,989,005.0 | 2,516,163.5 | 2,405,472.2 | 2,177,305.8 | 2,167,568.9 | 2,105,034.2 |
| North Carolina | 1,064,899.0 | 1,325,700.4 | 1,242,311.7 | 1,155,671.3 | 1,153,192.4 | 1,121,613.4 |
| North Dakota | 89,253.0 | 100,425.4 | 121,106.4 | 78,851.8 | 57,335.6 | 55,368.5 |
| Ohio | 757,834.0 | 878,300.8 | 880,958.4 | 756,090.9 | 735,824.0 | 719,584.0 |
| Oklahoma | 105,879.0 | 152,758.9 | 140,422.8 | 121,729.9 | 105,320.7 | 107,816.7 |
| Oregon | 333,528.0 | 421,523.4 | 412,509.2 | 372,274.8 | 354,627.9 | 344,690.2 |
| Pennsylvania | 1,515,609.0 | 1,928,098.5 | 1,887,536.7 | 1,784,882.3 | 1,710,584.4 | 1,622,268.3 |
| Rhode Island | 127,629.0 | 163,766.5 | 138,563.1 | 129,825.8 | 132,102.8 | 126,057.9 |
| South Carolina | 195,984.0 | 262,269.5 | 235,339.8 | 158,554.8 | 177,971.0 | 162,403.5 |
| South Dakota | 48,422.0 | 60,890.4 | 61,165.1 | 40,117.0 | 33,484.7 | 24,837.7 |
| Tennessee | 460,306.0 | 608,858.3 | 608,652.3 | 536,805.5 | 534,502.7 | 473,984.7 |
| Texas | 1,502,334.0 | 1,807,428.4 | 1,713,796.8 | 1,451,939.1 | 1,431,662.6 | 1,271,755.1 |
| Utah | 248,396.0 | 294,346.2 | 338,403.3 | 284,238.8 | 287,913.8 | 271,080.2 |
| Vermont | 81,719.0 | 100,217.5 | 89,951.5 | 79,153.3 | 60,493.4 | 72,404.3 |
| Virginia | 419,149.0 | 593,978.3 | 526,952.2 | 493,286.6 | 439,664.4 | 441,950.1 |
| Washington | 627,791.0 | 779,020.1 | 809,098.0 | 728,152.3 | 747,795.9 | 676,362.5 |
| West Virginia | 59,723.0 | 63,821.3 | 82,838.3 | 50,478.1 | 64,821.7 | 36,923.4 |
| Wisconsin | 524,207.0 | 694,650.0 | 615,296.9 | 552,122.8 | 558,725.3 | 517,410.2 |
| Wyoming | 25,712.0 | 33,473.2 | 38,478.6 | 26,104.0 | 26,623.4 | 27,583.0 |
| All states and outlying areas | 25,486,859.0 | 31,795,571.3 | 30,675,699.2 | 27,971,450.0 | 27,418,936.7 | 25,869,314.8 |